2  Core verbs for analytic pipelines utilising a database

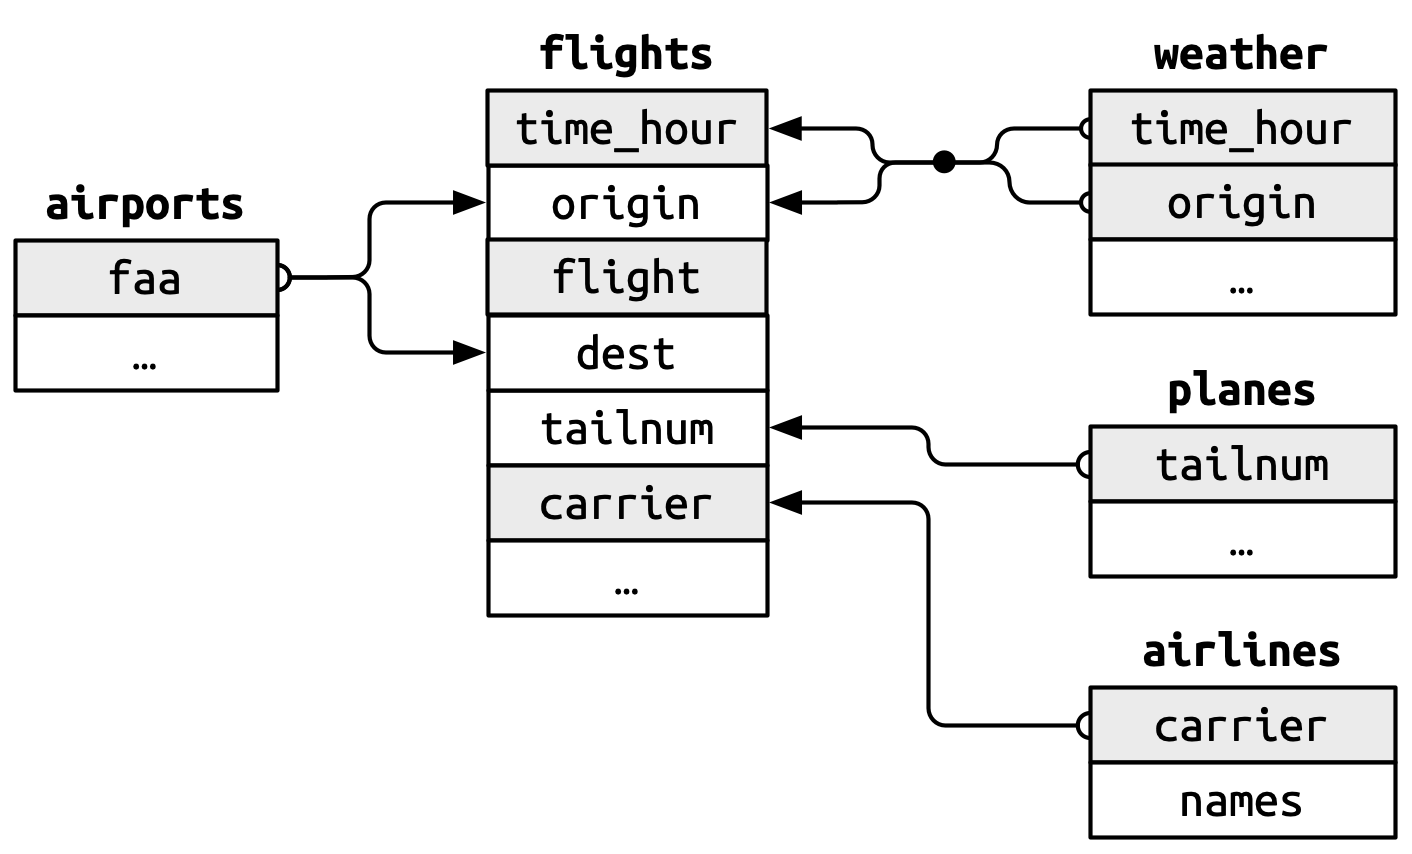
We saw in the previous chapter that we can use familiar dplyr verbs with data held in a database. In the last chapter we were working with just a single table which we loaded into the database. When working with databases we will though typically be working with multiple tables (which we’ll see later will be true when working with data in the OMOP CDM format). For this chapter we will see more tidyverse functionality that can be used with data in a database, this time using the nycflights13 data. As we can see, now we have a set of related tables with data on flights departing from New York City airports in 2013.

Let’s load the required libraries, add our data to a duckdb database, and then create references to each of these tables.

library(dplyr)
library(dbplyr)
library(tidyr)
library(duckdb)
library(DBI)

db <- dbConnect(duckdb(), dbdir = ":memory:")
copy_nycflights13(db)

airports_db <- tbl(db, "airports")
airports_db |> glimpse()
Rows: ??
Columns: 8
Database: DuckDB v1.1.3 [eburn@Windows 10 x64:R 4.4.0/:memory:]
$ faa   <chr> "04G", "06A", "06C", "06N", "09J", "0A9", "0G6", "0G7", "0P2", "…
$ name  <chr> "Lansdowne Airport", "Moton Field Municipal Airport", "Schaumbur…
$ lat   <dbl> 41.13047, 32.46057, 41.98934, 41.43191, 31.07447, 36.37122, 41.4…
$ lon   <dbl> -80.61958, -85.68003, -88.10124, -74.39156, -81.42778, -82.17342…
$ alt   <dbl> 1044, 264, 801, 523, 11, 1593, 730, 492, 1000, 108, 409, 875, 10…
$ tz    <dbl> -5, -6, -6, -5, -5, -5, -5, -5, -5, -8, -5, -6, -5, -5, -5, -5, …
$ dst   <chr> "A", "A", "A", "A", "A", "A", "A", "A", "U", "A", "A", "U", "A",…
$ tzone <chr> "America/New_York", "America/Chicago", "America/Chicago", "Ameri…
flights_db <- tbl(db, "flights")
flights_db |> glimpse()
Rows: ??
Columns: 19
Database: DuckDB v1.1.3 [eburn@Windows 10 x64:R 4.4.0/:memory:]
$ year           <int> 2013, 2013, 2013, 2013, 2013, 2013, 2013, 2013, 2013, 2…
$ month          <int> 1, 1, 1, 1, 1, 1, 1, 1, 1, 1, 1, 1, 1, 1, 1, 1, 1, 1, 1…
$ day            <int> 1, 1, 1, 1, 1, 1, 1, 1, 1, 1, 1, 1, 1, 1, 1, 1, 1, 1, 1…
$ dep_time       <int> 517, 533, 542, 544, 554, 554, 555, 557, 557, 558, 558, …
$ sched_dep_time <int> 515, 529, 540, 545, 600, 558, 600, 600, 600, 600, 600, …
$ dep_delay      <dbl> 2, 4, 2, -1, -6, -4, -5, -3, -3, -2, -2, -2, -2, -2, -1…
$ arr_time       <int> 830, 850, 923, 1004, 812, 740, 913, 709, 838, 753, 849,…
$ sched_arr_time <int> 819, 830, 850, 1022, 837, 728, 854, 723, 846, 745, 851,…
$ arr_delay      <dbl> 11, 20, 33, -18, -25, 12, 19, -14, -8, 8, -2, -3, 7, -1…
$ carrier        <chr> "UA", "UA", "AA", "B6", "DL", "UA", "B6", "EV", "B6", "…
$ flight         <int> 1545, 1714, 1141, 725, 461, 1696, 507, 5708, 79, 301, 4…
$ tailnum        <chr> "N14228", "N24211", "N619AA", "N804JB", "N668DN", "N394…
$ origin         <chr> "EWR", "LGA", "JFK", "JFK", "LGA", "EWR", "EWR", "LGA",…
$ dest           <chr> "IAH", "IAH", "MIA", "BQN", "ATL", "ORD", "FLL", "IAD",…
$ air_time       <dbl> 227, 227, 160, 183, 116, 150, 158, 53, 140, 138, 149, 1…
$ distance       <dbl> 1400, 1416, 1089, 1576, 762, 719, 1065, 229, 944, 733, …
$ hour           <dbl> 5, 5, 5, 5, 6, 5, 6, 6, 6, 6, 6, 6, 6, 6, 6, 5, 6, 6, 6…
$ minute         <dbl> 15, 29, 40, 45, 0, 58, 0, 0, 0, 0, 0, 0, 0, 0, 0, 59, 0…
$ time_hour      <dttm> 2013-01-01 10:00:00, 2013-01-01 10:00:00, 2013-01-01 1…
weather_db <- tbl(db, "weather")
weather_db |> glimpse()
Rows: ??
Columns: 15
Database: DuckDB v1.1.3 [eburn@Windows 10 x64:R 4.4.0/:memory:]
$ origin     <chr> "EWR", "EWR", "EWR", "EWR", "EWR", "EWR", "EWR", "EWR", "EW…
$ year       <int> 2013, 2013, 2013, 2013, 2013, 2013, 2013, 2013, 2013, 2013,…
$ month      <int> 1, 1, 1, 1, 1, 1, 1, 1, 1, 1, 1, 1, 1, 1, 1, 1, 1, 1, 1, 1,…
$ day        <int> 1, 1, 1, 1, 1, 1, 1, 1, 1, 1, 1, 1, 1, 1, 1, 1, 1, 1, 1, 1,…
$ hour       <int> 1, 2, 3, 4, 5, 6, 7, 8, 9, 10, 11, 13, 14, 15, 16, 17, 18, …
$ temp       <dbl> 39.02, 39.02, 39.02, 39.92, 39.02, 37.94, 39.02, 39.92, 39.…
$ dewp       <dbl> 26.06, 26.96, 28.04, 28.04, 28.04, 28.04, 28.04, 28.04, 28.…
$ humid      <dbl> 59.37, 61.63, 64.43, 62.21, 64.43, 67.21, 64.43, 62.21, 62.…
$ wind_dir   <dbl> 270, 250, 240, 250, 260, 240, 240, 250, 260, 260, 260, 330,…
$ wind_speed <dbl> 10.35702, 8.05546, 11.50780, 12.65858, 12.65858, 11.50780, …
$ wind_gust  <dbl> NA, NA, NA, NA, NA, NA, NA, NA, NA, NA, NA, NA, NA, NA, 20.…
$ precip     <dbl> 0, 0, 0, 0, 0, 0, 0, 0, 0, 0, 0, 0, 0, 0, 0, 0, 0, 0, 0, 0,…
$ pressure   <dbl> 1012.0, 1012.3, 1012.5, 1012.2, 1011.9, 1012.4, 1012.2, 101…
$ visib      <dbl> 10, 10, 10, 10, 10, 10, 10, 10, 10, 10, 10, 10, 10, 10, 10,…
$ time_hour  <dttm> 2013-01-01 06:00:00, 2013-01-01 07:00:00, 2013-01-01 08:00…
planes_db <- tbl(db, "planes")
planes_db |> glimpse()
Rows: ??
Columns: 9
Database: DuckDB v1.1.3 [eburn@Windows 10 x64:R 4.4.0/:memory:]
$ tailnum      <chr> "N10156", "N102UW", "N103US", "N104UW", "N10575", "N105UW…
$ year         <int> 2004, 1998, 1999, 1999, 2002, 1999, 1999, 1999, 1999, 199…
$ type         <chr> "Fixed wing multi engine", "Fixed wing multi engine", "Fi…
$ manufacturer <chr> "EMBRAER", "AIRBUS INDUSTRIE", "AIRBUS INDUSTRIE", "AIRBU…
$ model        <chr> "EMB-145XR", "A320-214", "A320-214", "A320-214", "EMB-145…
$ engines      <int> 2, 2, 2, 2, 2, 2, 2, 2, 2, 2, 2, 2, 2, 2, 2, 2, 2, 2, 2, …
$ seats        <int> 55, 182, 182, 182, 55, 182, 182, 182, 182, 182, 55, 55, 5…
$ speed        <int> NA, NA, NA, NA, NA, NA, NA, NA, NA, NA, NA, NA, NA, NA, N…
$ engine       <chr> "Turbo-fan", "Turbo-fan", "Turbo-fan", "Turbo-fan", "Turb…
airlines_db <- tbl(db, "airlines")
airlines_db |> glimpse()
Rows: ??
Columns: 2
Database: DuckDB v1.1.3 [eburn@Windows 10 x64:R 4.4.0/:memory:]
$ carrier <chr> "9E", "AA", "AS", "B6", "DL", "EV", "F9", "FL", "HA", "MQ", "O…
$ name    <chr> "Endeavor Air Inc.", "American Airlines Inc.", "Alaska Airline…

2.0.1 Tidyverse functions

For almost all analyses we want to go from having our starting data spread out across multiple tables in the database to a single tidy table containing the data we need for an analysis. We can often get to our tidy analytic dataset using the below tidyverse functions (most of which coming from dplyr, but a couple also from the tidyr package). These functions all work with data in a database by generating SQL that will have the same purpose as if these functions were being run against data in R.

Important

Remember, until we use compute() or collect() (or printing the first few rows of the result) all we’re doing is translating R code into SQL.

Purpose Functions Description
Selecting rows filter, distinct To select rows in a table.
Ordering rows arrange To order rows in a table.
Column Transformation mutate, select, relocate, rename To create new columns or change existing ones.
Grouping and ungrouping group_by, ungroup To group data by one or more variables and to remove grouping.
Aggregation count, tally, summarise These functions are used for summarising data.
Data merging and joining inner_join, left_join, right_join, anti_join, cross_join These functions are used to combine data from different tables based on common columns.
Data reshaping pivot_wider, pivot_longer These functions are used to reshape data between wide and long formats.
Data union union_all This function combines two tables.
Randomly selects rows slice_sample We can use this to take a random subset a table.

By using the above functions we can use the same code regardless of whether the data was held in the database or locally in R. This is because the functions used above are generic functions which behave differently depending on the type of input they are given. Let’s take inner_join() for example. We can see that this function is a S3 generic function (with S3 being the most common object-oriented system used in R).

library(sloop)
ftype(inner_join)
[1] "S3"      "generic"

Among others, the references we create to tables in a database have tbl_lazy as a class attribute. Meanwhile, we can see that when collected into r the object changes to have different attributes, one of which being data.frame

class(flights_db)
[1] "tbl_duckdb_connection" "tbl_dbi"               "tbl_sql"              
[4] "tbl_lazy"              "tbl"                  
class(flights_db |> head(1) |> collect())
[1] "tbl_df"     "tbl"        "data.frame"

We can see that inner_join() has different methods for tbl_lazy and data.frame.

s3_methods_generic("inner_join")
# A tibble: 2 × 4
  generic    class      visible source             
  <chr>      <chr>      <lgl>   <chr>              
1 inner_join data.frame FALSE   registered S3method
2 inner_join tbl_lazy   FALSE   registered S3method

When working with references to tables in the database the tbl_lazy method will be used.

s3_dispatch(flights_db |> 
              inner_join(planes_db))
   inner_join.tbl_duckdb_connection
   inner_join.tbl_dbi
   inner_join.tbl_sql
=> inner_join.tbl_lazy
   inner_join.tbl
   inner_join.default

But once we bring data into r, the data.frame method will be used.

s3_dispatch(flights_db |> head(1) |> collect() |> 
              inner_join(planes_db |> head(1) |> collect()))
   inner_join.tbl_df
   inner_join.tbl
=> inner_join.data.frame
   inner_join.default

2.1 Getting to an analytic dataset

To see a little more on how we can use the above functions, let’s say we want to do an analysis of late flights from JFK airport. We want to see whether there is some relationship between plane characteristics and the risk of delay.

For this we’ll first use the filter() and select() dplyr verbs to get the data from the flights table. Note, we’ll rename arr_delay to just delay.

delayed_flights_db <- flights_db |> 
  filter(!is.na(arr_delay),
        origin == "JFK") |> 
  select(dest, 
         distance, 
         carrier, 
         tailnum, 
         "delay" = "arr_delay")
<SQL>
SELECT dest, distance, carrier, tailnum, arr_delay AS delay
FROM flights
WHERE (NOT((arr_delay IS NULL))) AND (origin = 'JFK')

And when executed, our results will look like the following

delayed_flights_db
# Source:   SQL [?? x 5]
# Database: DuckDB v1.1.3 [eburn@Windows 10 x64:R 4.4.0/:memory:]
   dest  distance carrier tailnum delay
   <chr>    <dbl> <chr>   <chr>   <dbl>
 1 MIA       1089 AA      N619AA     33
 2 BQN       1576 B6      N804JB    -18
 3 MCO        944 B6      N593JB     -8
 4 PBI       1028 B6      N793JB     -2
 5 TPA       1005 B6      N657JB     -3
 6 LAX       2475 UA      N29129      7
 7 BOS        187 B6      N708JB     -4
 8 ATL        760 DL      N3739P     -8
 9 SFO       2586 UA      N532UA     14
10 RSW       1074 B6      N635JB      4
# ℹ more rows

Now we’ll add plane characteristics from the planes table. We will use an inner join so that only records for which we have the plane characteristics will be kept.

delayed_flights_db <- delayed_flights_db |> 
  inner_join(planes_db |> 
              select(tailnum, 
                     seats),
            by = join_by(tailnum))

Note that our first query was not executed, as we didn’t use either compute() or collect(), so we’ll now have added our join to the original query.

<SQL>
SELECT LHS.*, seats
FROM (
  SELECT dest, distance, carrier, tailnum, arr_delay AS delay
  FROM flights
  WHERE (NOT((arr_delay IS NULL))) AND (origin = 'JFK')
) LHS
INNER JOIN planes
  ON (LHS.tailnum = planes.tailnum)

And when executed, our results will look like the following

delayed_flights_db
# Source:   SQL [?? x 6]
# Database: DuckDB v1.1.3 [eburn@Windows 10 x64:R 4.4.0/:memory:]
   dest  distance carrier tailnum delay seats
   <chr>    <dbl> <chr>   <chr>   <dbl> <int>
 1 BQN       1576 B6      N804JB    -18   200
 2 MCO        944 B6      N593JB     -8   200
 3 PBI       1028 B6      N793JB     -2   200
 4 BOS        187 B6      N708JB     -4   200
 5 ATL        760 DL      N3739P     -8   189
 6 SJU       1598 B6      N794JB    -21   200
 7 PHX       2153 US      N535UW      0   379
 8 BOS        187 B6      N805JB    -10   200
 9 LAS       2248 B6      N558JB     -6   200
10 SLC       1990 DL      N3763D     -9   189
# ℹ more rows

Getting to this tidy dataset has been done in the database via R code translated to SQL. With this, we can now collect our analytic dataset into R and go from there (for example, to perform statistical analyses not possible to run in a database).

delayed_flights <- delayed_flights_db |> 
  collect() 

delayed_flights |> 
 glimpse()
Rows: 93,298
Columns: 6
$ dest     <chr> "LAX", "CLT", "SFO", "ATL", "FLL", "BUF", "RSW", "LAS", "PHX"…
$ distance <dbl> 2475, 541, 2586, 760, 1069, 301, 1074, 2248, 2153, 1005, 2475…
$ carrier  <chr> "UA", "US", "UA", "DL", "B6", "B6", "B6", "B6", "US", "B6", "…
$ tailnum  <chr> "N34137", "N117UW", "N502UA", "N681DA", "N568JB", "N236JB", "…
$ delay    <dbl> -10, -34, 7, -12, -3, 2, 2, 0, -35, 7, -12, 11, -20, -10, -1,…
$ seats    <int> 178, 182, 178, 178, 200, 20, 200, 200, 379, 200, 200, 178, 17…